|
|
Chart Appearance
All Chart Appearance properties are gathered on Chart Properties/Appearance tab:
Render Settings
-
Skin Type - defines type of the skin (color schema: chart background color, candle' color) that is applied to a chart.
-
Scale Type - set scale type for Y-Axis, supported values: Normal (linear type), Log and Square Root.
-
Stick Render Type - available types: Column, Thick Column, Single Line, .
-
Stock Render Type -
|
Candle
|

|
|
HLCBars
|

|
|
OHLCBars
|

|
|
Line
|

|
-
Show X-Axis mode - Default (use skin settings), On Each Area (each area will have x-axis), On Last Area (only last area will have x-axis), On First Area (only first area will have x-axis).
Other Settings
-
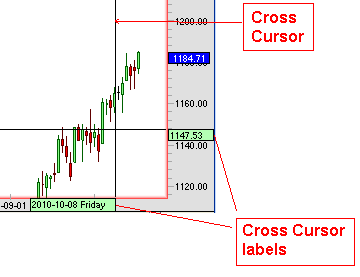
Show Cross Cursor - show/hide chart cross cursor (see on the picture below).
-
Show Cursor Label - show/hide chart cross cursor label (see on the picture below).
-
Show Indicator Values - show/hide indicator values in Statistic Window.
-
Fixed Time - show/hide missing bars (bars in non market time, holidays).
-
Show Overlay Values in Statistic Window - show/hide overlay values in Statistic Window.
-
Show Statistic Window - show/hide Statistic Window.
-
Use Memory Buffering - optimize chart rendering using memory double buffering (unxhexk this option for low performance PCs).
-
Autoscale Y-Axis - automatically rescale chart to fit STOCK and indicators lines and bars (candles).
-
Adjust Data - use this option in a combination with Autoscale Y-Axis to apply autoscale mechanism for STOCK data only.
|
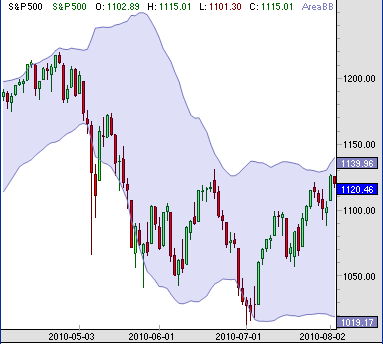
Autoscale
|
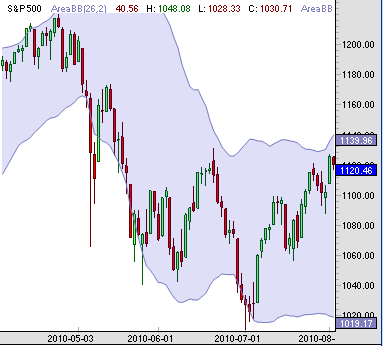
Autoscale+Adjust Data
|
|
|
|
-
Bonds - use Bonds instead of decimal fraction part, supported values are: 1/32nd and 1/64th.
|